
The Challenge
A major regulator of taxi services in the US works with third party service providers and car share services, like Uber and Lyft, to provide citizens and tourists visiting the National Capital with a high quality, safe, and efficient experience.
In order to fulfill its mission, the commission depends on accurate reporting about the taxicab fleets under its remit. However, with multiple data sets stored in various systems (including driver/vehicle records, lost and found reports, complaints, trip locations, and more), the commission struggled to connect and aggregate that data for more fluid, centralized reporting. And, with roughly 15,000 taxi drivers and 40,000 unique daily trips registered in its system, the data collected over months and years was becoming substantial and unwieldy.
A major pain point for the commission was its reliance on static Microsoft Excel spreadsheets to compile and share key performance indicators (KPIs) about taxicab services, a task that limited the organization’s ability to see the whole picture or explore that data further.
The commission needed a better way to monitor and analyze evolving data about its services—everything from driver performance, route information, impounded vehicle reports, to lost and found property updates.
The Solution
The commission required a business intelligence system capable of processing large amounts of data. Furthermore, in order for the casual user to drill down, explore, and get answers to pressing business questions, the solution also needed to incorporate an intuitive dashboard interface with some of the charts providing real-time information.
In response to these challenges, EastBanc Technologies developed a Microsoft Power BI infrastructure to meet our client’s dynamic and real-time reporting needs.
Microsoft Power BI is a cloud-based suite of business analytics tools for easy data analysis, querying, and reporting—all within the browser interface. With support for “big picture” performance, and the ability to drill down for historical views and trend analysis, Power BI transforms data into rich interactive visuals.
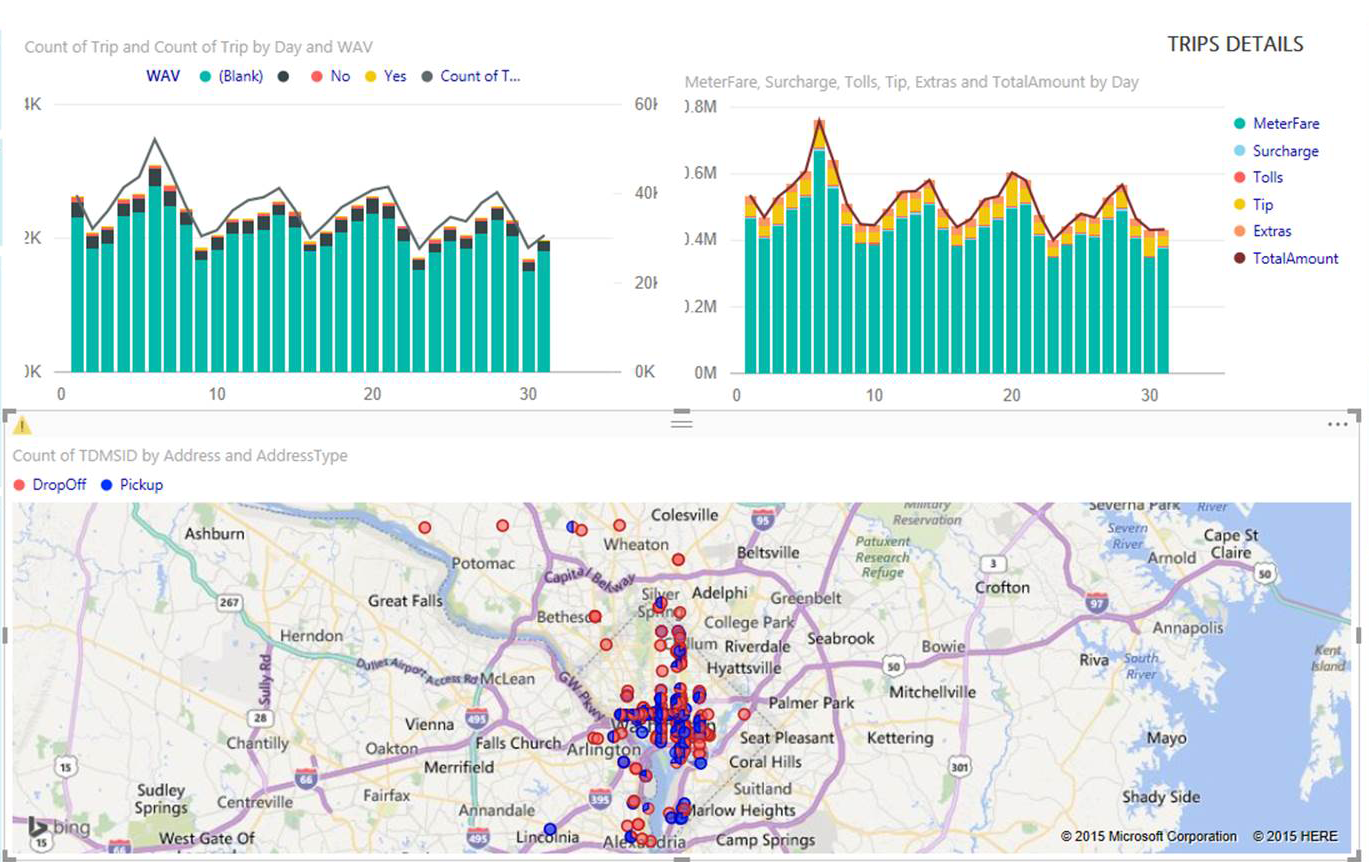
In addition, the solution’s powerful mapping interface leverages data about vehicle locations to map underserved areas, show popular trip destinations and origination points, resulting in more informed decision-making and monitoring capabilities.
Sample reports include:
To support additional data retention and transformation, the environment also included Microsoft Azure SQL intermediary storage running in the cloud. Microsoft specifically tailored Power BI and Azure to meet the demand for data analytics in a cost-efficient manner. Furthermore, Azure and Power BI have built-in connectivity and integration which we leveraged to architect connectors between the Azure cloud and the commission’s on-premise environment. This ensures the smooth flow of data influx without interruption and quicker access to our client’s ever expanding data pool from within Power BI.
The Results
This worry-free, self-service business intelligence solution has empowered the commission to become more efficient and proficient in managing its own business data.
With a low price per-seat, the commission has offloaded its data processing and analytics to the cloud, while enabling non-technical users to experience the power of advanced business intelligence, without the need for excessive intervention from the IT department.
The commission can now visualize previously disparate and un-mineable data. Using a live dashboard and a single view of critical data about the District of Columbia’s entire taxi fleet, users can create stunning interactive reports, share them in seconds, enforce consistent analysis across the organization— all with intuitive language and drag and drop gestures.
It couldn’t be any easier for the commission to monitor service delivery, discover inaccuracies in data, and many other valuable business insights, while enjoying the cost-savings of cloud technology.
To learn how EastBanc Technologies’ experts can help your organization thrive, contact:
Jill DaSilva| Director of Sales Operations | jdasilva@eastbanctech.com


